/E�F�Ͻ���I(y��)��(k��)4.jpg)

 Save
Save Print
Print��Ferro-alloys.com��: World crude steel production for the 69 countries reporting to the World Steel Association (worldsteel) was 166.1 million tonnes (Mt) in March 2025, a 2.9% increase compared to March 2024.
Crude steel production by region
Africa produced 1.9 Mt in March 2025, up 0.6% on March 2024. Asia and Oceania produced 123.6 Mt, up 3.9%. The EU (27) produced 11.7 Mt, up 0.2%. Europe, Other produced 3.6 Mt, down 7.2%. The Middle East produced 5.3 Mt, up 1.9%. North America produced 9.2 Mt, up 1.4%. Russia & other CIS + Ukraine produced 7.1 Mt, down 3.5%. South America produced 3.7 Mt, up 6.5%.
Table 1. Crude steel production by region

The 69 countries included in this table accounted for approximately 98% of total world crude steel production in 2024.
Regions and countries covered by the table:
Africa: Algeria, Egypt, Libya, Morocco, South Africa, Tunisia
Asia and Oceania: Australia, China, India, Japan, Mongolia, New Zealand, Pakistan, South Korea, Taiwan (China), Thailand, Viet Nam
European Union (27): Austria, Belgium, Bulgaria, Croatia, Czechia, Finland, France, Germany, Greece, Italy, Luxembourg, Netherlands, Poland, Portugal, Romania, Slovakia, Slovenia, Spain, Sweden
Europe, Other: Macedonia, Norway, Serbia, Türkiye, United Kingdom
Middle East: Bahrain, Iran, Iraq, Jordan, Kuwait, Oman, Qatar, Saudi Arabia, United Arab Emirates, Yemen
North America: Canada, Cuba, El Salvador, Guatemala, Mexico, United States
Russia & other CIS + Ukraine: Kazakhstan, Russia, Ukraine
South America: Argentina, Brazil, Chile, Colombia, Ecuador, Paraguay, Peru, Uruguay, Venezuela
Top 10 steel-producing countries
China produced 92.8 Mt in March 2025, up 4.6% on March 2024. India produced 13.8 Mt, up 7.0%. Japan produced 7.2 Mt, up 0.2%. The United States produced 6.7 Mt, down 1.5%. Russia is estimated to have produced 6.2 Mt, down 3.2%. South Korea produced 5.0 Mt, down 5.3%. Türkiye produced 3.1 Mt, down 2.8%. Germany is estimated to have produced 3.1 Mt, down 11.7%. Brazil produced 2.9 Mt, up 6.6%. Iran produced 3.3 Mt, up 3.7%.
Table 2. Top 10 steel-producing countries
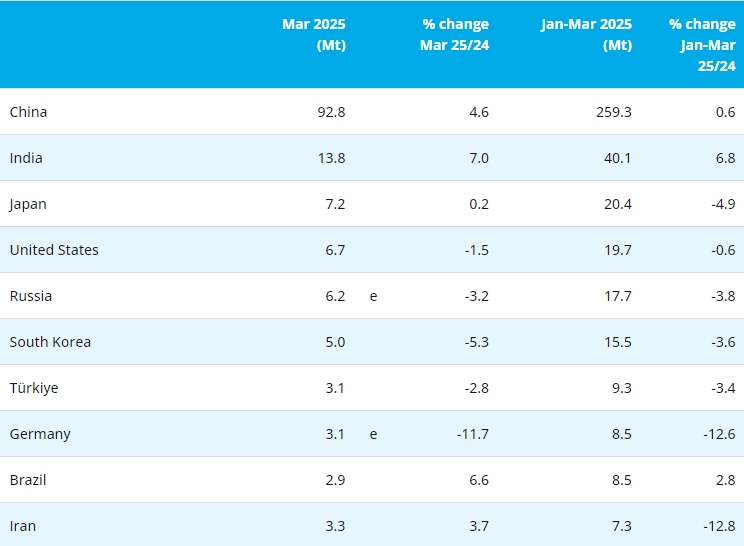
e – estimated. Ranking of top 10 producing countries is based on year-to-date aggregate
Copyright © 2013 Ferro-Alloys.Com. All Rights Reserved. Without permission, any unit and individual shall not copy or reprint!
- [Editor:Alakay]
 Daily News
 Research
 Magazine
 Company Database
 Customized Database
 Conferences
 Advertisement
 Trade
Trade


?b��o)/2024/QQ�؈D20250402170922.png)
?b��o)/2024/�ňDƬ_20250328161757.jpg)

 Online inquiry
 Contact

Tell Us What You Think